
Introduction:
Wicomico County is already feeling the effects of climate change but the future of temperatures changes, precipitation patterns and severe storms will be determined by what we do to reduce our carbon emissions. The more we can reduce our carbon emissions, the more we will be able to slow the effects we see from climate change. While reducing our carbon emission by 70% or more is ideal to slow the changes, we must reduce emission by at least 40% to make a difference [5]. Regardless of our changes in emissions, we can expect to see a 2°F increase in mean global temperature by 2025 [2]. Although we won't see more total rainfall, our rainfall events will become more sporadic and heavier when we do receive rainfall. The future of severe storms is the most uncertain of impacts we could see from climate change because of their dependency on temperature and precipitation patterns. Understanding future impacts from storms such as hurricanes would require us to be able to map storm tracks into the future, which we still struggle with days beforehand let alone months or years. What we do know is those storms that are going to impact us will have stronger winds, heavier rains and higher storm surge than the storms we see today. For more information on the possible impacts to temperature, precipitation patterns and severe storms as a result of climate change, be sure to click through the tabs below.
Wicomico County is already feeling the effects of climate change but the future of temperatures changes, precipitation patterns and severe storms will be determined by what we do to reduce our carbon emissions. The more we can reduce our carbon emissions, the more we will be able to slow the effects we see from climate change. While reducing our carbon emission by 70% or more is ideal to slow the changes, we must reduce emission by at least 40% to make a difference [5]. Regardless of our changes in emissions, we can expect to see a 2°F increase in mean global temperature by 2025 [2]. Although we won't see more total rainfall, our rainfall events will become more sporadic and heavier when we do receive rainfall. The future of severe storms is the most uncertain of impacts we could see from climate change because of their dependency on temperature and precipitation patterns. Understanding future impacts from storms such as hurricanes would require us to be able to map storm tracks into the future, which we still struggle with days beforehand let alone months or years. What we do know is those storms that are going to impact us will have stronger winds, heavier rains and higher storm surge than the storms we see today. For more information on the possible impacts to temperature, precipitation patterns and severe storms as a result of climate change, be sure to click through the tabs below.
Introduction:
Wicomico County is already feeling the effects of increasing temperatures as a result of climate change but the effects of these increases on the future will be determined by what we do to reduce our carbon emissions. When most people think of climate change, one of the first things to come to mind is global warming and increasing temperatures. While, yes, we have seen increases in mean global temperature in the past, we are seeing them today and we will inevitably see them in the future, climate change doesn't mean it’s always going to be warm. As a result of climate change, we are more likely to see climate extremes such as severe heat waves in the summer and extreme cold snaps in the winter as a result of typical weather patterns, but the overall climate will warm.
Wicomico County is already feeling the effects of increasing temperatures as a result of climate change but the effects of these increases on the future will be determined by what we do to reduce our carbon emissions. When most people think of climate change, one of the first things to come to mind is global warming and increasing temperatures. While, yes, we have seen increases in mean global temperature in the past, we are seeing them today and we will inevitably see them in the future, climate change doesn't mean it’s always going to be warm. As a result of climate change, we are more likely to see climate extremes such as severe heat waves in the summer and extreme cold snaps in the winter as a result of typical weather patterns, but the overall climate will warm.
What we will see in the Future - implications of changing carbon emissions
Overall, increases in summer temperatures will be slightly greater than increases in winter temperatures, with the increases being more extreme if carbon emissions are not reduced. Temperature changes in Wicomico County and other counties on the Eastern Shore are going to be slightly less (0.5-1°F difference) than those seen in the western part of the state but will still be significant. The State of Maryland has predicted that a "low emissions path has held temperature increase to 4.8°F in summer, and 4°F in winter, while the higher emission scenario leads to warming of nearly 9°F in summer and 7°F in winter," with none of the projections studied predicting less than a 4°F increase in summer temperatures by 2100 [2].
|
Heat waves are also going to become more normal in the coming years. The average number of days with high temperatures above 90°F in the late twentieth century was roughly 30 with only two days on average reaching 100°F. These numbers are predicted to increase significantly throughout the twenty first century, with the number of days above 90°F predicted to double under a low emissions scenario or possibly triple with continuously high emissions. This means that almost all average summer days would exceed 90°F. Failing to reduce our carbon emissions could also increase the number of days exceeding 100°F five-fold [2].
While heat waves will effect the entirety of the Wicomico County as well as much of the country, heat waves will also increase the urban heat island effect in many cities, including Salisbury. The urban heat island effect is a phenomenon that causes urban areas experience significantly warmer temperatures (as much as 7°F warmer) throughout the day than surrounding suburban and rural areas [12]. This occurs because "city surfaces absorb more of the sun's heat during the day and emit that heat back into the air at night" [12]. As a result, the more pavement and impervious surfaces a city has, the warmer it will be while "plants and pervious surfaces make cities cooler through water retention and evaporation" [12]. |
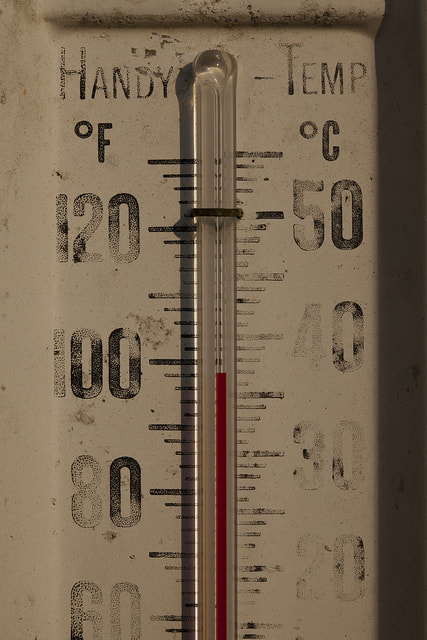
Photo credit: Ray Bodden, flickr
|
"Peaking global emissions by 2020 and declining to near zero by mid-century are necessary to maintain these thresholds and avoid the most dangerous consequences of climate change"
- Maryland Commission on Climate Change
Projections for the future suggest there will be another 2°F increase in mean global temperature regardless of whether or not we are able to reduce our carbon emissions [2]. The Maryland Commission on Climate Change states that “in order to limit the temperature increase to this level, the IPCC calculated that global GHG emission must be reduced by 40 to 70 percent from 2010 levels by 2050, and further to near or below zero in 2100” [5] After 2025, rates of change are going to depend on if we are able to significantly (~70%) reduce our carbon emissions or whether it is going to take a longer period of time. Reducing carbon emission significantly by 2020 “and declining to near zero by mid-century are necessary to maintain these thresholds and avoid the most dangerous consequences of climate change” [5].
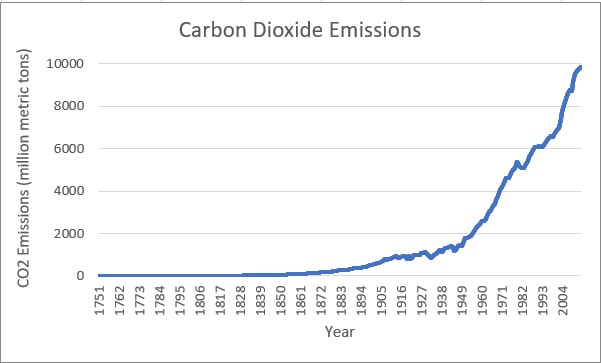
Global CO2 Emissions from Fossil-Fuel Burning, Cement Manufacture, and Gas Flaring: 1751-2014
What we have already seen
Scientists have been documenting changes in mean global temperature since the early twentieth century. We have already seen a 2°F increase in annual temperature between 1977 and 1999, a warming trend that has since continued [2]. Many of the warmest years on record have occurred in the past two decades "with 16 of the 17 warmest years on record occurring since 2001, with 2016 being the warmest year on record [3].
Increasing temperatures and electricity demand
As a result of increasing summer temperatures, it is predicted that we will see a shift in peak demand for electricity. Currently, Maryland has pretty equal demands for electricity for heating in the winter and cooling in the summer, with summer demands just slightly greater than those during the winter. Increasing summer temperatures could skew this demand to peak during the summer months because of the increased need for air conditioning with decreased demand during the warmer winter months [4].
temperature and the Chesapeake Bay
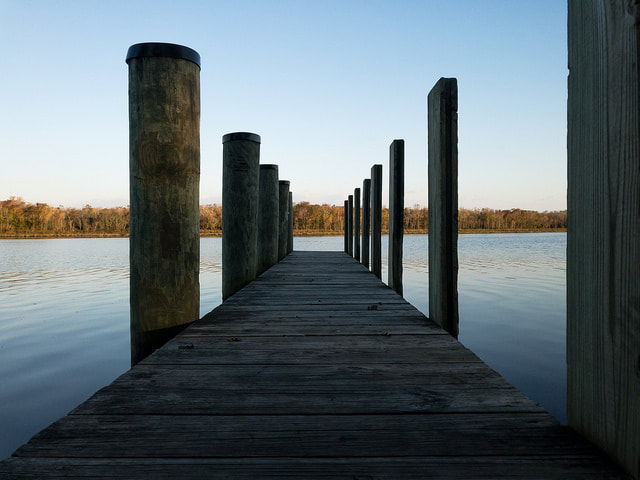
Photo credit: Chesapeake Bay Program, flickr
|
Similar to the increases in air temperature we are seeing today and will see into the future, we are also seeing an increase in water temperatures throughout the Chesapeake Bay as well as in our oceans. Warmer air temperatures are going to directly lead to warmer water temperature that will ultimately impact the health of the Bay and its species. Since the 1940's we have seen an increase of roughly 0.4°F per decade, with much of this change occurring in the past 30 years, a total change of about 2.8°F since 1940 [2]. Although this may not seem like a huge difference, many of the organisms that live in the shallow waters that are most affected by changes in air temperature rely on water temperatures to tell them when to move up and down the Bay for breeding season.
|
The Maryland Commission on Climate Change suggests water temperatures could see "increases of 4°F by 2050 in the higher emissions scenario and 2.5°F for the low emissions path" [2]. By 2100, these predictions could reach 9°F (high emissions) and 5°F (low emissions) respectively [2]. To put this into perspective, a 4 to 5°F increase in water temperature under a low emissions scenario would make Bay temperatures in the summer very similar to water temperatures in North Carolina's sounds today. Under the high emissions scenario, summertime water temperatures in the Bay could be comparable to that of South Florida today [2].
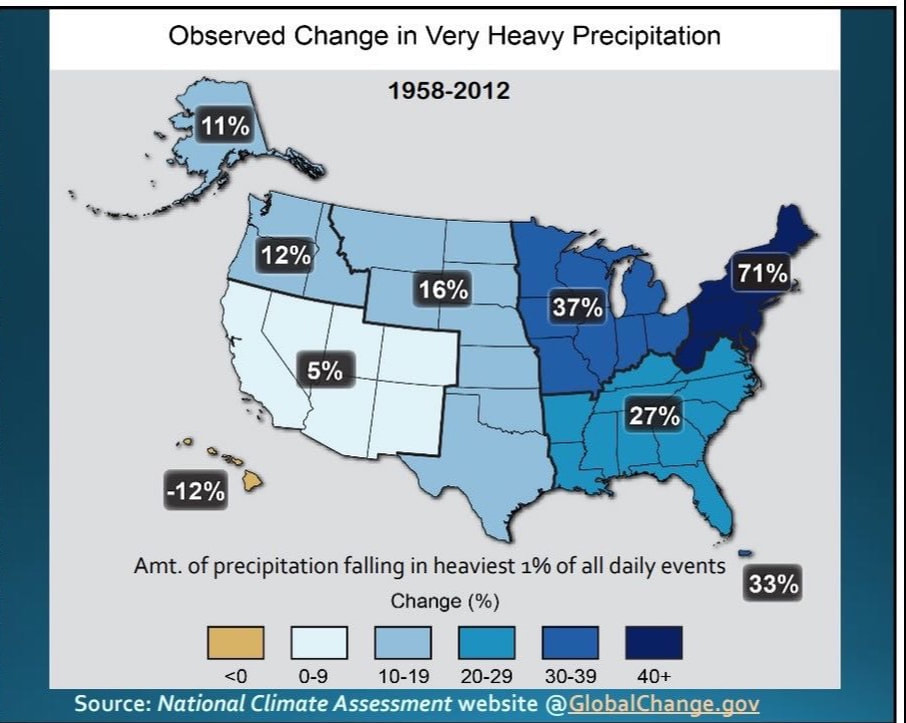
The East coast has the highest increase of overall precipitation
Precipitation in the Delmarva Peninsula
Precipitation data for Wicomico County and the greater Delmarva Peninsula is gathered by two weather balloons located in Norfolk, Virginia and Washington, D.C. Rain and snow remain the two major forms of precipitation, with an average around 112 cm per year. Nearly 50% of annual precipitation is lost to the atmosphere due to evapotranspiration, while the rest is absorbed into the groundwater supply or enters streams [7].
A study was conducted in 2015 which focused on developing a practical and effective framework for the long-term monitoring of wetland lands in the Delmarva Peninsula using LiDAR and Landsat imagery. They found Salisbury's land-cover was predominately agriculture (42%), followed by wetlands (31%) and forest (11%) [7]. Wetland areas are likely to absorb the highest amount of precipitation, but also are more likely to flood [7].
Precipitation in Wicomico County
Due to the increase in the frequency of intense rains, Wicomico County Public Works is seeking changes to be made regarding their current drainage systems. Furthermore, since Wicomico county is not currently part of FEMA's Community Rating System (CRS), Public Works is working to apply.
FEMA's Community Rating System
According to Assistant Director of Administration of Wicomico County Public Works, Weston Young, if accepted, a floodplain management program would be created for Wicomico county in order to enhance public safety, protect the environment, as well as reduce damage to property and public infrastructure [8]. The CRS program would also help with educating citizens who live in low lying areas as well as potentially reducing their flood insurance costs [8]. Combining tidal surge maps from the Emergency Services Department, the Public Works department will utilize their GIS system to determine which areas of the county are impacted at different tide heights. For emergency purposes, this would help with identifying necessary evacuation zones and proposed detours for traffic [8]. Young claims, "from a Public Works standpoint, we look to see if we can raise the elevation of our infrastructure, such as our roadways, so that as sea levels rise and tidal surges occur the roads remain high and dry" [8].
Precipitation Basics
As defined by NASA, precipitation is considered to be "any product of the condensation of atmospheric water vapor that falls quickly out of a cloud, more specifically when a local portion of the atmosphere becomes saturated with water vapor and the water condenses" [6]. The main forms of precipitation include drizzle, rain, sleet, snow, and hail.
How is precipitation effected by climate change?
According to NASA, as temperatures begin to rise, the Earth's water cycle will become more intense. As a result, evaporation will increase which will result in more storms, but "also contribute to drying over some lands areas" [6]. Therefore, "storm-affected areas are likely to experience increases in precipitation and increased risk of flooding, while areas located far away from storm tracks are likely to experience less precipitation and increased risk of drought" [6]. To find out more information, click the video below:
Introduction:
Of all of the changes brought on by climate change, the impacts of severe storms contain the most uncertainty, especially in Wicomico County. This level of uncertainty stems from the fact that the formation and intensity of these storms are dependent on temperature and precipitation levels. Although we are able to predict changes to temperature and precipitation with reasonable certainty, scientists are unable to say with much certainty what exactly will happen as a result of these changes.
Of all of the changes brought on by climate change, the impacts of severe storms contain the most uncertainty, especially in Wicomico County. This level of uncertainty stems from the fact that the formation and intensity of these storms are dependent on temperature and precipitation levels. Although we are able to predict changes to temperature and precipitation with reasonable certainty, scientists are unable to say with much certainty what exactly will happen as a result of these changes.
Thunderstorms:
As temperatures and the frequency of periods of heavy rainfall increase, the threat for thunderstorms also increases. Thunderstorms are caused by the rising of parcels of hot air from the surface into the upper atmosphere in an unstable atmosphere. The atmosphere becomes unstable “when a column of air is warmer at the surface than it is at higher altitudes” [9]. Because the air is unstable, it will continue to rise, and convection will ultimately lead to the development of thunderstorms if enough moisture is present in the atmosphere [9]. “As air rises, it cools. If there is water vapor in the air, it condenses into cloud droplets or precipitation. When water vapor condenses, it releases heat into the atmosphere. The heat makes the surrounding air buoyant, boosting the rising air even higher” [9]. This is why thunderstorms clouds or cumulonimbus extend so far up into the atmosphere. The more water vapor in the atmosphere (when combined with warmer temperatures) “means more potential heat to be released through condensation and stronger updrafts, fueling potentially stronger storms” [9].
As temperatures and the frequency of periods of heavy rainfall increase, the threat for thunderstorms also increases. Thunderstorms are caused by the rising of parcels of hot air from the surface into the upper atmosphere in an unstable atmosphere. The atmosphere becomes unstable “when a column of air is warmer at the surface than it is at higher altitudes” [9]. Because the air is unstable, it will continue to rise, and convection will ultimately lead to the development of thunderstorms if enough moisture is present in the atmosphere [9]. “As air rises, it cools. If there is water vapor in the air, it condenses into cloud droplets or precipitation. When water vapor condenses, it releases heat into the atmosphere. The heat makes the surrounding air buoyant, boosting the rising air even higher” [9]. This is why thunderstorms clouds or cumulonimbus extend so far up into the atmosphere. The more water vapor in the atmosphere (when combined with warmer temperatures) “means more potential heat to be released through condensation and stronger updrafts, fueling potentially stronger storms” [9].
Tropical and Non-Tropical Cyclones:
Tropical cyclones such as tropical storms and hurricanes have made major headlines around the world recently after the extremely devastating 2017 Atlantic hurricane season. With a total of seventeen named storms including four hurricanes (categories 1 and 2) and six major hurricanes (categories 3, 4 and 5), it may not have been the most active in recent years, but it has been one of the most destructive, with two major hurricanes making landfall in the United States (Harvey and Irma) and another (Maria) following Irma's path, devastating many of the same islands in the Caribbean [10]. These storms reignited concerns from both scientists and the public over the possible impacts climate change could have on hurricane strength and effects in the future; a topic that has hidden in the shadows since Hurricane Katrina in 2005.
Tropical cyclones such as tropical storms and hurricanes have made major headlines around the world recently after the extremely devastating 2017 Atlantic hurricane season. With a total of seventeen named storms including four hurricanes (categories 1 and 2) and six major hurricanes (categories 3, 4 and 5), it may not have been the most active in recent years, but it has been one of the most destructive, with two major hurricanes making landfall in the United States (Harvey and Irma) and another (Maria) following Irma's path, devastating many of the same islands in the Caribbean [10]. These storms reignited concerns from both scientists and the public over the possible impacts climate change could have on hurricane strength and effects in the future; a topic that has hidden in the shadows since Hurricane Katrina in 2005.
|
What impacts could we see from future hurricane seasons?
Scientists aren't certain what impact climate change is going to have on hurricanes. They have predicted a likely increase in rains and winds associated with the storms but changes to the frequency of storms are unknown [2]. Maryland's Cost of Inaction report (2011) suggests that there could be as much as a 3-5% increase in hurricane wind speeds for every 1.8°F increase in sea surface temperatures [11]. "Two very recent studies..." (as of 2008) "have actually projected a decrease in hurricane and tropical storm frequency" but this is yet to be a widely accepted consensus [2]. Although we understand that an increase in air temperatures will lead to an increase in sea surface temperatures which should ultimately create better conditions for hurricane formation, it is unclear as to what impact this could have on Wicomico County. This would depend on the path storms take which is hard to predict days to weeks let alone years or decades in the future, but warmer sea surface temperatures could make hurricanes in the mid-Atlantic region more frequent and/or intense. |
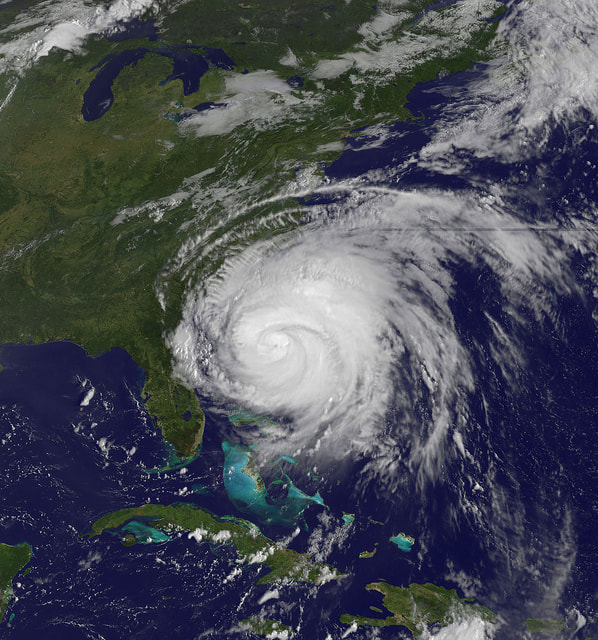
Photo credit: NASA Goddard Space Flight Center
|
What scientists are able to predict is an increase in the frequency and intensity of non-tropical cyclones (Nor'easters). Warming sea surface temperatures will allow these storms to more easily move up the coast, bringing stronger winds, more precipitation and more extreme tidal impacts including higher wave heights and storm surge [2].
|
Defining Weather and Climate:
According to NOAA (the National Oceanic and Atmospheric Administration [1]):
|
"Climate is what you expect, weather is what you get" Be sure to check out these resources related to weather and climate:
|
For more information about the impacts of climate change on land,water and climate, check out the links below:
References
Video: Storm Shield App. "Weather vs. Climate: What's the Difference?". YouTube. YouTube, 5 April 2016, https://www.youtube.com/watch?time_continue=2&v=SosJzEn1G0s
Video: NASA Goddard. "NASA's Analysis of 2016 Global Temperature". YouTube. YouTube, 18 Jan 2016, https://www.youtube.com/watch?time_continue=46&v=s3RWTTtPg8E
Video: climatecentraldotorg. “Extreme Weather 101: Climate Change and Precipitation.” YouTube. YouTube, 23 July 2015, www.youtube.com/watch?v=pNMm90nzT4o.
Video: eHowEducation. "Environmental Science and Weather: How Thunderstorms Form." YouTube. YouTube, 1 April 2010, https://www.youtube.com/watch?v=eYZaRYKHHvU
Chart data: Global CO2 Emissions from Fossil-Fuel Burning, Cement Manufacture, and Gas Flaring: 1751-2014. (2017). Carbon Dioxide Information Analysis Center. Retrieved from: http://cdiac.ess-dive.lbl.gov/ftp/ndp030/global.1751_2014.ems
- “What is the difference between weather and climate?” (2017). National Oceanic and Atmospheric Administration. Retrieved from: https://oceanservice.noaa.gov/facts/weather_climate.html
- Comprehensive Assessment of Climate Change Impacts in Maryland. (2008). Maryland Commission on Climate Change. Retrieved from: http://www.mde.state.md.us/programs/Air/ClimateChange/Documents/FINAL-Chapt%202%20Impacts_web.pdf
- “NASA, NOAA Data Show 2016 Warmest Year on Record Globally”. (2017). NASA. Retrieved from: https://www.nasa.gov/press-release/nasa-noaa-data-show-2016-warmest-year-on-record-globally
- 2016 Annual Report. (2016). Maryland Commission on Climate Change. Retrieved from http://www.mde.state.md.us/programs/Air/ClimateChange/MCCC/Documents/MCCC_2016_final.pdf
- 2017 Annual Report. (2017). Maryland Commission on Climate Change. Retrieved from; http://mde.maryland.gov/programs/Air/ClimateChange/MCCC/Documents/MCCC_2017_final.pdf
- NASA, NASA, pmm.nasa.gov/
- Jin, Huiran, et al. “Monitoring of Wetland Inundation Dynamics in the Delmarva Peninsula Using Landsat Time-Series Imagery from 1985 to 2011.” Remote Sensing of the Environment, vol. 190, 1 Mar. 2017, pp. 26–41., www.sciencedirect.com/science/article/pii/S0034425716304758.
- Young, W. (2018, February 23). Wicomico County Public Works: Climate Change Preperation [E-mail].
- “NOAA’s CSI Team Investigates Tornado Outbreak.” (2011). NOAA. Retrieved from: https://www.climate.gov/news-features/understanding-climate/noaas-csi-team-investigates-tornado-outbreak
- National Hurricane Center. (2017). Retrieved from: https://www.nhc.noaa.gov/data/tcr/
- Climate Change and the Cost of Inaction in Maryland. (2011). The Center for Integrative Environmental Research (CIER) at the University of Maryland. Retrieved from: http://mde.maryland.gov/programs/Air/ClimateChange/Documents/2011%20Draft%20Plan/F_Cost_of_Inaction.pdf
- "ClimateBits: Urban Heat Islands." (2018). NOAA. Retrieved from: https://sos.noaa.gov/datasets/climatebits-urban-heat-islands/
Video: Storm Shield App. "Weather vs. Climate: What's the Difference?". YouTube. YouTube, 5 April 2016, https://www.youtube.com/watch?time_continue=2&v=SosJzEn1G0s
Video: NASA Goddard. "NASA's Analysis of 2016 Global Temperature". YouTube. YouTube, 18 Jan 2016, https://www.youtube.com/watch?time_continue=46&v=s3RWTTtPg8E
Video: climatecentraldotorg. “Extreme Weather 101: Climate Change and Precipitation.” YouTube. YouTube, 23 July 2015, www.youtube.com/watch?v=pNMm90nzT4o.
Video: eHowEducation. "Environmental Science and Weather: How Thunderstorms Form." YouTube. YouTube, 1 April 2010, https://www.youtube.com/watch?v=eYZaRYKHHvU
Chart data: Global CO2 Emissions from Fossil-Fuel Burning, Cement Manufacture, and Gas Flaring: 1751-2014. (2017). Carbon Dioxide Information Analysis Center. Retrieved from: http://cdiac.ess-dive.lbl.gov/ftp/ndp030/global.1751_2014.ems
