
Transportation
Transportation is the 2nd leading source of greenhouse gas emissions in the United States. While systematic infrastructure changes are called for in order to seriously address our country's emissions, individual choices and actions can also have a big impact.
In the section below, you will find the more information on the most influential way to reduce your individual carbon footprint from transportation: living car-free. While this may seem unrealistic in Wicomico County, especially for its rural populations, the tabs below provide resources to make this goal achievable!
In the section below, you will find the more information on the most influential way to reduce your individual carbon footprint from transportation: living car-free. While this may seem unrealistic in Wicomico County, especially for its rural populations, the tabs below provide resources to make this goal achievable!
Living Car-Free
Developed nations must drastically reduce their carbon footprints in order to prevent additional global climate change for future generations. According to a comprehensive study in 2017, among the most effective actions is moving away from a polluting technology, even when compared to using the cleanest available technology or incremental technological improvements [5].
Living car-free: 2.4 tonnes of carbon dioxide emissions (tCO2e) per year LOWER than the baseline of a gasoline car
Electric vehicles (cleanest available technology): 1.25 tCO2e per year lower than the baseline of a gasoline car [5]
If electric vehicle usage rises to 16% of total passenger miles by 2050, 10.8 gigatons (10.8 billion metric tons) of CO2 from fuel combustion could be avoided [8]. However, it is important to understand that, “though electric cars may replace internal combustion vehicles and shrink the carbon footprint of the automobile, the car-based transport model itself,” still allows for the kind of development and lifestyle that is associated with higher emissions per capita, greater consumption, and greater energy usage [5]. "Both cycling and mass transit will need to account for a large share of travel in urban areas in the future if cities are to become less dependent on cars" [4].
Click HERE for more interesting facts on the impacts of transportation in the United States!
Living car-free: 2.4 tonnes of carbon dioxide emissions (tCO2e) per year LOWER than the baseline of a gasoline car
- Reduces traffic congestion [6]
- Reduces petroleum dependence [6]
- Avoids environmental toxicity issues surrounding electric vehicle production [7]
- Reduces the need to build more roads and parking spaces [5]
- Supports higher-density urban design [5]
Electric vehicles (cleanest available technology): 1.25 tCO2e per year lower than the baseline of a gasoline car [5]
- Electric cars still emit 1.15 tCO2e per year on average
- Plug-in hybrids rely on electricity, now predominantly generated by burning coal [1]
- More efficient cars still emit 1.21 tCO2e per year on average
If electric vehicle usage rises to 16% of total passenger miles by 2050, 10.8 gigatons (10.8 billion metric tons) of CO2 from fuel combustion could be avoided [8]. However, it is important to understand that, “though electric cars may replace internal combustion vehicles and shrink the carbon footprint of the automobile, the car-based transport model itself,” still allows for the kind of development and lifestyle that is associated with higher emissions per capita, greater consumption, and greater energy usage [5]. "Both cycling and mass transit will need to account for a large share of travel in urban areas in the future if cities are to become less dependent on cars" [4].
Click HERE for more interesting facts on the impacts of transportation in the United States!
Shifting Gears to Cycling:
By 2050, if 7.5% of urban trips globally are by bike, 2.3 billion metric tons (2.3 gigatons) of CO2 emissions can be avoided [8]. If city dwellers use bicycles for about 10% of their urban trips in big cities worldwide by 2050, greenhouse gas emissions would decrease by 11%, saving society $2.4 trillion in infrastructure and other costs [3].
“By building bike infrastructure rather than roads, municipal governments, and taxpayers can realize $400 billion in savings over 30 years and $2.1 trillion in lifetime savings” [10]. "The costs saved in lower energy use and reducing the need for car travel, new roads and parking lots through 2050 are substantial" [4]. Moreover, bikes require less energy to produce than motor vehicles [11].
In order to allow for and promote increased cycling, cities need to make substantial changes to their policies and infrastructure, such as:
The more people there are cycling on city streets, the more support there is for bike lanes and other cycling infrastructure [13].
“By building bike infrastructure rather than roads, municipal governments, and taxpayers can realize $400 billion in savings over 30 years and $2.1 trillion in lifetime savings” [10]. "The costs saved in lower energy use and reducing the need for car travel, new roads and parking lots through 2050 are substantial" [4]. Moreover, bikes require less energy to produce than motor vehicles [11].
In order to allow for and promote increased cycling, cities need to make substantial changes to their policies and infrastructure, such as:
- Rapidly developing large-scale networks of well-lit bike lanes or paths.
- The more direct, level, and interconnected the better.
- Coordinating access to public transport, secure bike parking, and workplace showers.
- Implementing city bike-share programs, with an emphasis on connections to transit.
- Ensuring safe, well-designed intersections, roundabouts, and points of access (where bicycles and cars meet).
- Revising laws to protect cyclists and pedestrians.
- Ending subsidies for driving, like parking minimums and fuel subsidies. [8, 12]
The more people there are cycling on city streets, the more support there is for bike lanes and other cycling infrastructure [13].
LOCAL RESOURCES:
Don't own a bike? No problem!
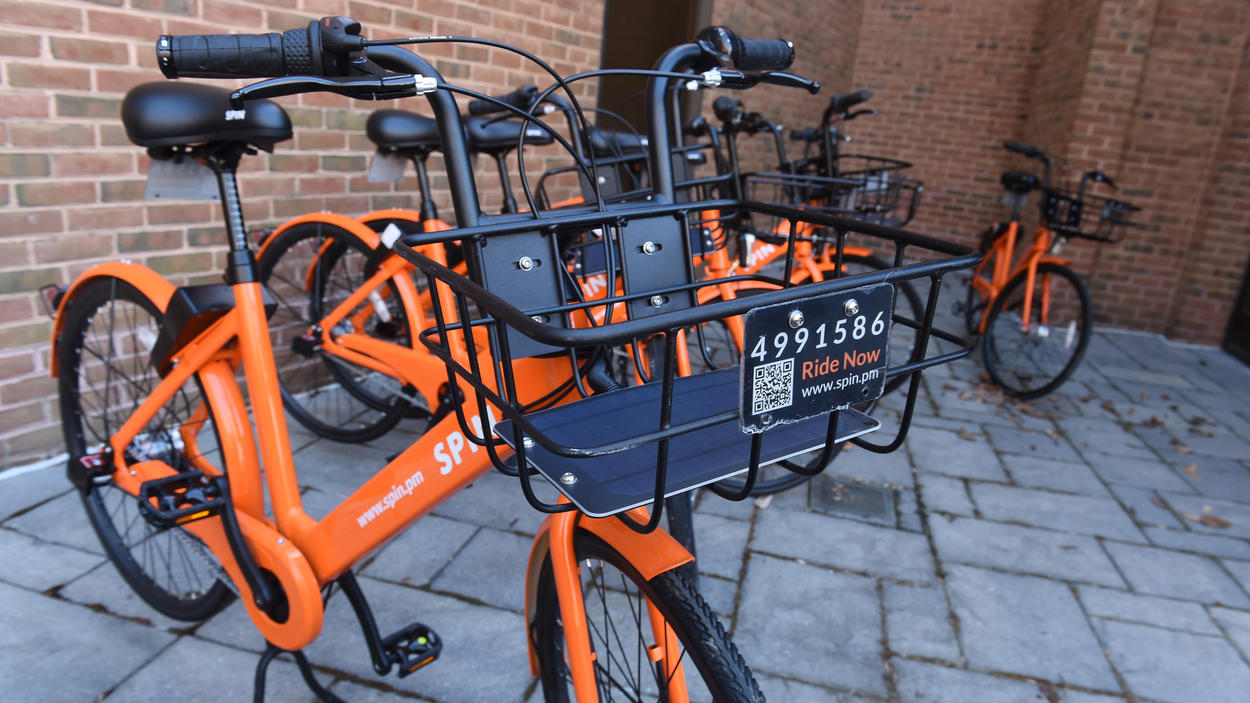
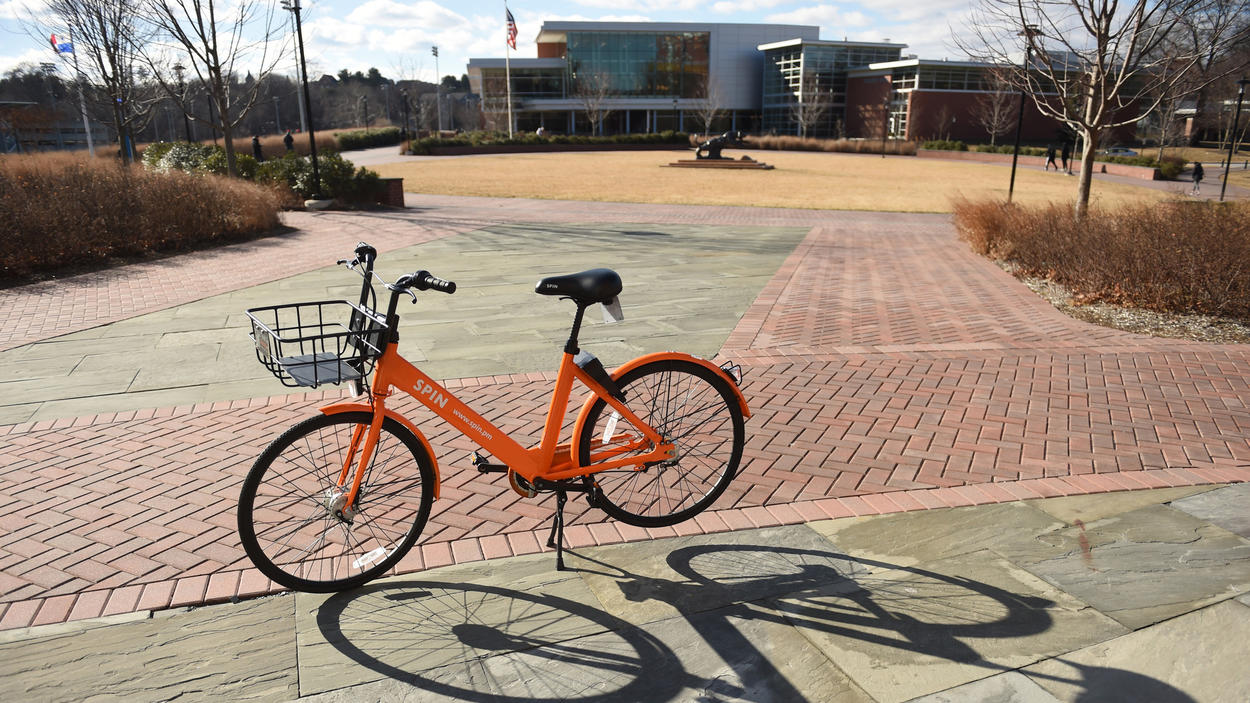
The City of Salisbury has partnered with SPIN bikes to provide low-cost, easy-to-rent bikes available across the city!
Bike share program brings new rides to Salisbury
Bike share program brings new rides to Salisbury
WHERE CAN I FIND A SPIN BIKE?
The bikes are spread out across over 10 bike racks in downtown, Salisbury University and private businesses like Evolution Craft Brewing Co. & Public House.
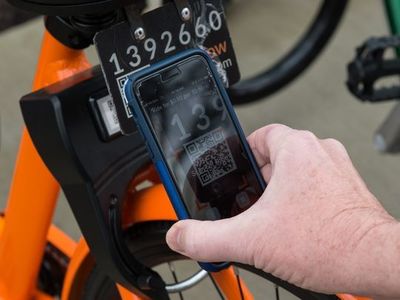
HOW CAN I RENT A SPIN BIKE?
Hitching a ride is simple!
- PAYMENT: First, download the Spin app on your phone, create an account, and set up your payment method (e.g., credit card or debit card) in the app.
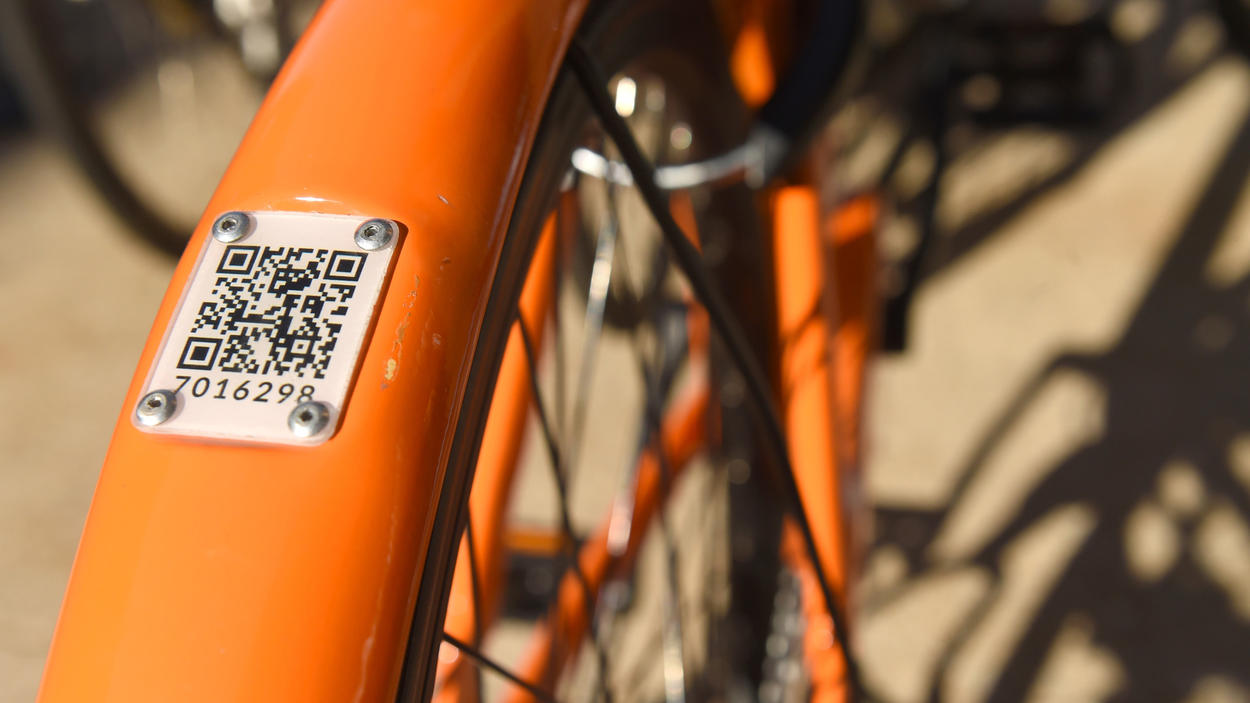
- FIND A BIKE: Either walk around or use the app's map to find an available bike. scan the bike' QR code or manually enter its license plate.
- UNLOCK THE BIKE: Scan the bike's QR code or manually enter its license plate. The bike will "chirp" and unlock.
- AFTER YOU'RE DONE: After the 30-minute ride is completed, customers can lock the bike by pressing down the lock mechanism located underneath the bike seat!
COST?
For a 30-minute ride, customers pay $1 (or 50 cents for SU students and staff). Customers can also pay a $14 monthly rate for unlimited 30-minute rides.
WHAT FEATURES DOES A SPIN BIKE HAVE?
Its orange bikes are equipped with a front basket, solar-powered lights, solar-powered locks with GPS, adjustable seats and three-speed gear shifts.
See the pictures below so you can spot one in your area!
See the pictures below so you can spot one in your area!
Even if the number of miles travelled remains the same, switching from driving a sedan to
taking public transit has been shown to reduce emissions by
26%–76% [5, 14].
taking public transit has been shown to reduce emissions by
26%–76% [5, 14].
|
If use of mass transit grows just 3% by 2050, this solution can save 6.6 gigatons (6.6 billion metric tons) of CO2 emissions from cars. “All mass transit modes use scale to their emissions advantage. When someone opts to ride a streetcar, bus, or subway rather than driving a car or hailing a cab, greenhouse gases are averted.
|
|
Public Transportation in Wicomico County
This free website (Link) helps you to find a Wicomico County route, schedule and timetable for you local bus, or Wicomico County coach line, countywide!
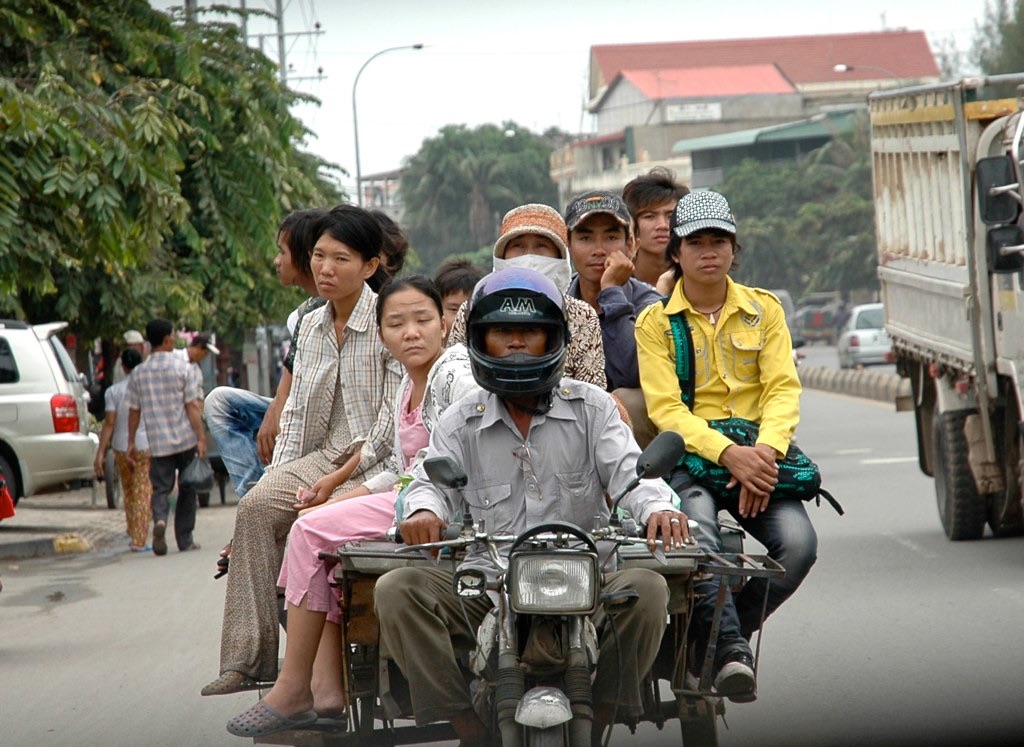
"We need to share resources to have resources.”
- Paul Hawken [9]
Photo Credit: Byron Hetrick, Flickr
How much does transportation contribute to climate change?
Burning a single gallon of gasoline produces
20 pounds of CO2 [1].
20 pounds of CO2 [1].
- "Transport produces 7 gigatons of CO2e greenhouse gas (GHG) emissions annually, or 23% of energy-related emissions, which is around 14% of all emissions" [2].
- "If global annual CO2 emissions from urban transportation continue on their current trajectory, they stand to increase from 2.3 gigatonnes of CO2 in 2015 to 4.3 gigatonnes in 2050" [3, 4].
Click on the following buttons to find out more of the most influential ways you can make a difference:
References
- Biello, M. (2007). 10 Solutions for Climate Change. Scientific American. Retrieved from https://www.scientificamerican.com/article/10-solutions-for-climate-change/#
- Project Drawdown. (n.d.). Transport: Sector summary. Retrieved from http://www.drawdown.org/solutions/transport
- Mason, J., Fulton, L., & McDonald, Z. (2015). A Global High Shift Cycling Scenario: The Potential for Dramatically Increasing Bicycle and E-bike Use in Cities Around the World, with Estimated Energy, CO2, and Cost Impacts. Retrieved from https://www.itdp.org/wp-content/uploads/2015/11/A-Global-High-Shift-Cycling-Scenario-_-Nov-12-2015.pdf
- Magill, B. (2015). Shifting Gears to Cycling Would be Big Climate Boost. Retrieved from http://www.climatecentral.org/news/cycling-climate-boost-19682
- Wynes, S., & Nicholas, K. (2017). The climate mitigation gap: education and government recommendations miss the most effective individual actions. Environmental Research Letters, 12(7). https://doi.org/10.1088/1748-9326/aa7541
- Mashayekh, Y., Jaramillo, P., Samaras, C., Hendrickson, T., Blackhurst, M., MacLean, L., & Matthews, S. (2012). Potentials for sustainable transportation in cities to alleviate climate change impacts. Environmental Science and Technology, 46(5). https://pubs.acs.org/doi/10.1021/es203353q
- Hawkins, T., Singh, B., Majeau‐Bettez, G., & Strømman, A. (2012). Comparative environmental life cycle assessment of conventional and electric vehicles. Journal of Industrial Ecology, 17(1). https://onlinelibrary.wiley.com/doi/abs/10.1111/j.1530-9290.2012.00532.x
- Hawken, P. (Ed.). (2017). Drawdown: The Most Comprehensive Plan Ever Proposed to Reverse Global Warming. New York: Penguin Books.
- Hawken, P. (Ed.). (2017). Drawdown: The Most Comprehensive Plan Ever Proposed to Reverse Global Warming. New York: Penguin Books. [p. 145]
- Hawken, P. (Ed.). (2017). Drawdown: The Most Comprehensive Plan Ever Proposed to Reverse Global Warming. New York: Penguin Books. [p. 89]
- Martin, M. (n.d.). How riding a bike reduces global warming. Retrieved from http://homeguides.sfgate.com/riding-bike-reduces-global-warming-78905.html
- Schmitt, A. (2015). How much can bicycling help fight climate change? A lot, if cities try. Retrieved from https://usa.streetsblog.org/2015/11/18/how-much-can-bicycling-help-fight-climate-change-a-lot-if-cities-try/
- Magill, B. (2014). How climate friendly is bike sharing? It’s complicated. Retrieved from http://www.climatecentral.org/news/bike-sharing-complicated-climate-impact-17910
- Chester, M., Pincetl, S., Elizabeth, Z., Eisenstein, W., & Matute, J. (2013) Infrastructure and automobile shifts: positioning transit to reduce life-cycle environmental impacts for urban sustainability goals. Environmental Research Letters, 8(1). http://iopscience.iop.org/article/10.1088/1748-9326/8/1/015041/meta
- Project Drawdown. (n.d.). Transport: Mass transit. Retrieved from http://www.drawdown.org/solutions/transport/mass-transit
